

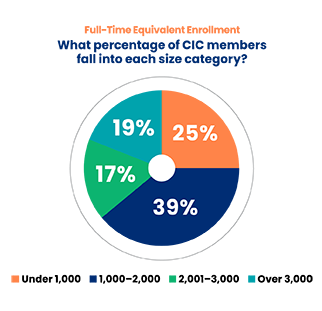
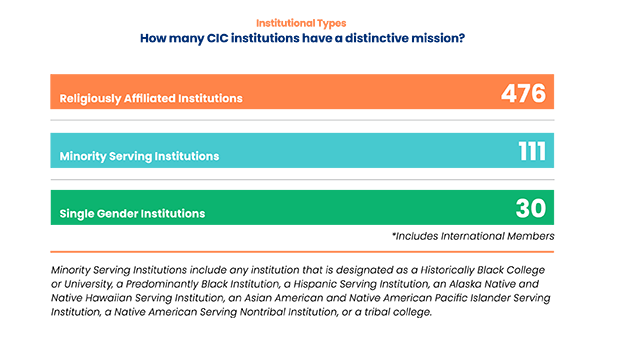
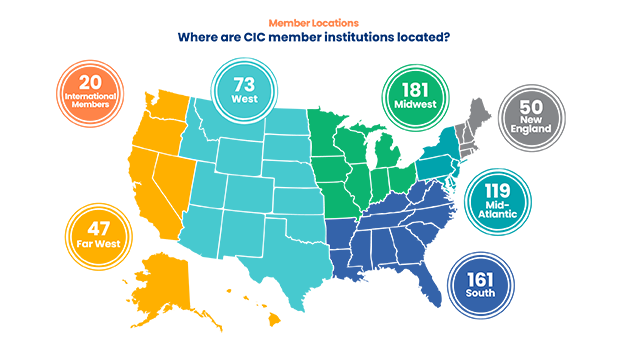
CIC’s membership includes more than 700 nonprofit independent colleges and universities, state-based councils of independent colleges, and other higher education affiliates. Members represent a variety of locations, missions, programs, resources, sizes and interests.
Information on this page is updated as of June 30, 2026, and included in the 2025–26 CIC Annual Report.
Overall Membership
Carnegie Classifications
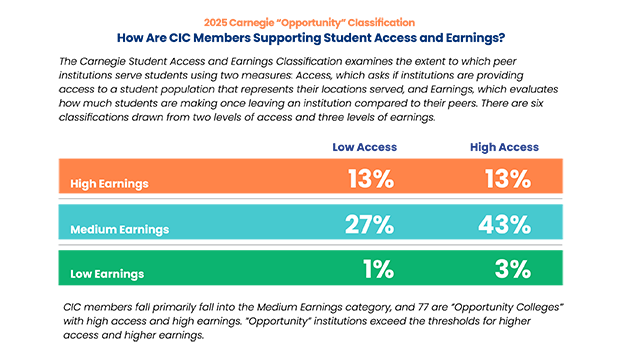
In 2025, new Carnegie Classifications were released. CIC members are represented across the institutional classifications and demonstrate strong outcomes in the new student access and earnings “opportunity” classification.
2025 Carnegie Institutional Classification of CIC Members
The most recent Carnegie Classifications were released in Spring 2025. CIC members in 2025-26 are represented in most of the 31 descriptive Institutional Classifications which are built on three pillars: award level focus, academic program mix, and size. CIC members fall into many of these categories. The ten classifications with the most members are shown below.
| Mixed: Baccalaureate | 45 |
| Mixed: Undergraduate/Graduate-Master’s Small | 25 |
| Mixed: Undergraduate/Graduate-Doctorate Small | 21 |
| Mixed: Undergraduate/Graduate-Doctorate Medium | 15 |
| Professions-Focused: Baccalaureate Small | 111 |
| Professions-Focused: Undergraduate/Graduate-Master’s Small | 76 |
| Professions-Focused: Undergraduate/Graduate-Master’s Large/Medium | 25 |
| Professions-Focused: Undergraduate/Graduate-Doctorate Small | 48 |
| Professions-Focused: Undergraduate/Graduate-Doctorate Medium | 61 |
| Special Focus: Arts and Sciences | 125 |
| Special Focus: Nursing | 19 |
| Special Focus: Other Health Professions | 18 |
| Other Institutional Classification | 42 |
2025 Carnegie Student Access and Earnings “Opportunity” Classification
CIC Membership Survey
Every three years, CIC administers a survey to member presidents to better understand their needs and how CIC can best support them. In 2025, 13 percent of member institutions responded to the survey; they were representative of CIC’s overall membership. All responses indicated that CIC programs and services are valuable and responsive to current issues in independent higher education. In particular, respondents found professional development programs such as the Presidents Institute and the Institute for Chief Academic Officers, networks such as the Tuition Exchange Program and NetVUE, and research such as the KIT and FIT reports to be important.
In 2025, members noted the following issues to be top of mind:
- The financial model for higher education and financial health and sustainability
- The public perception of higher education
- Navigating federal policy and legislation
- Adapting to technological change